hot spot analyses (Getis-Ord Gi*)
As part of the MIT Enhancing Water Affordability Project, we conducted hot spot analyses in Seattle, Chicago, and Alexandria to understand water poverty in U.S. cities and explore local and federal policy responses. This analysis is carried out in RStudio, beginning with data processing and culminating in hotspot maps that reveal spatial and demographic patterns in urban neighborhoods most affected by water affordability challenges.
City of Chicago hot spot analysis: Water shutoffs 2016 - 2019; Households enrolled in customer assistance programs 2019; and Demographic indicators
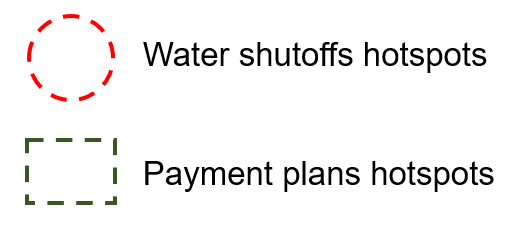
This hot spot analysis shows that most customer assistance programs are not being allocated to water shutoff clusters in segregated Chicago neighborhoods.

City of Alexandria hot spot analysis: Water shutoffs 2017 - 2020; Households enrolled in customer assistance programs 08/20 - 07/21; Households enrolled in federal programs; and Demographic indicators
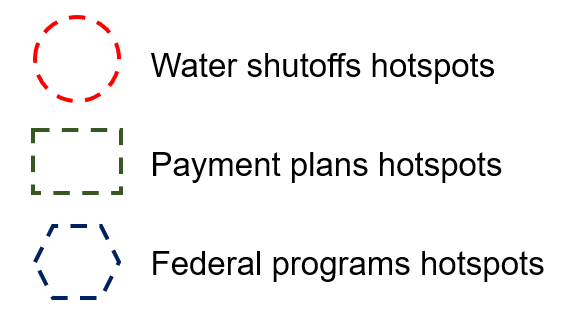
This hot spot analysis shows that customer assistance programs and federal programs are only being allocated to a neighborhood with high rates of water shutoffs in South Alexandria.
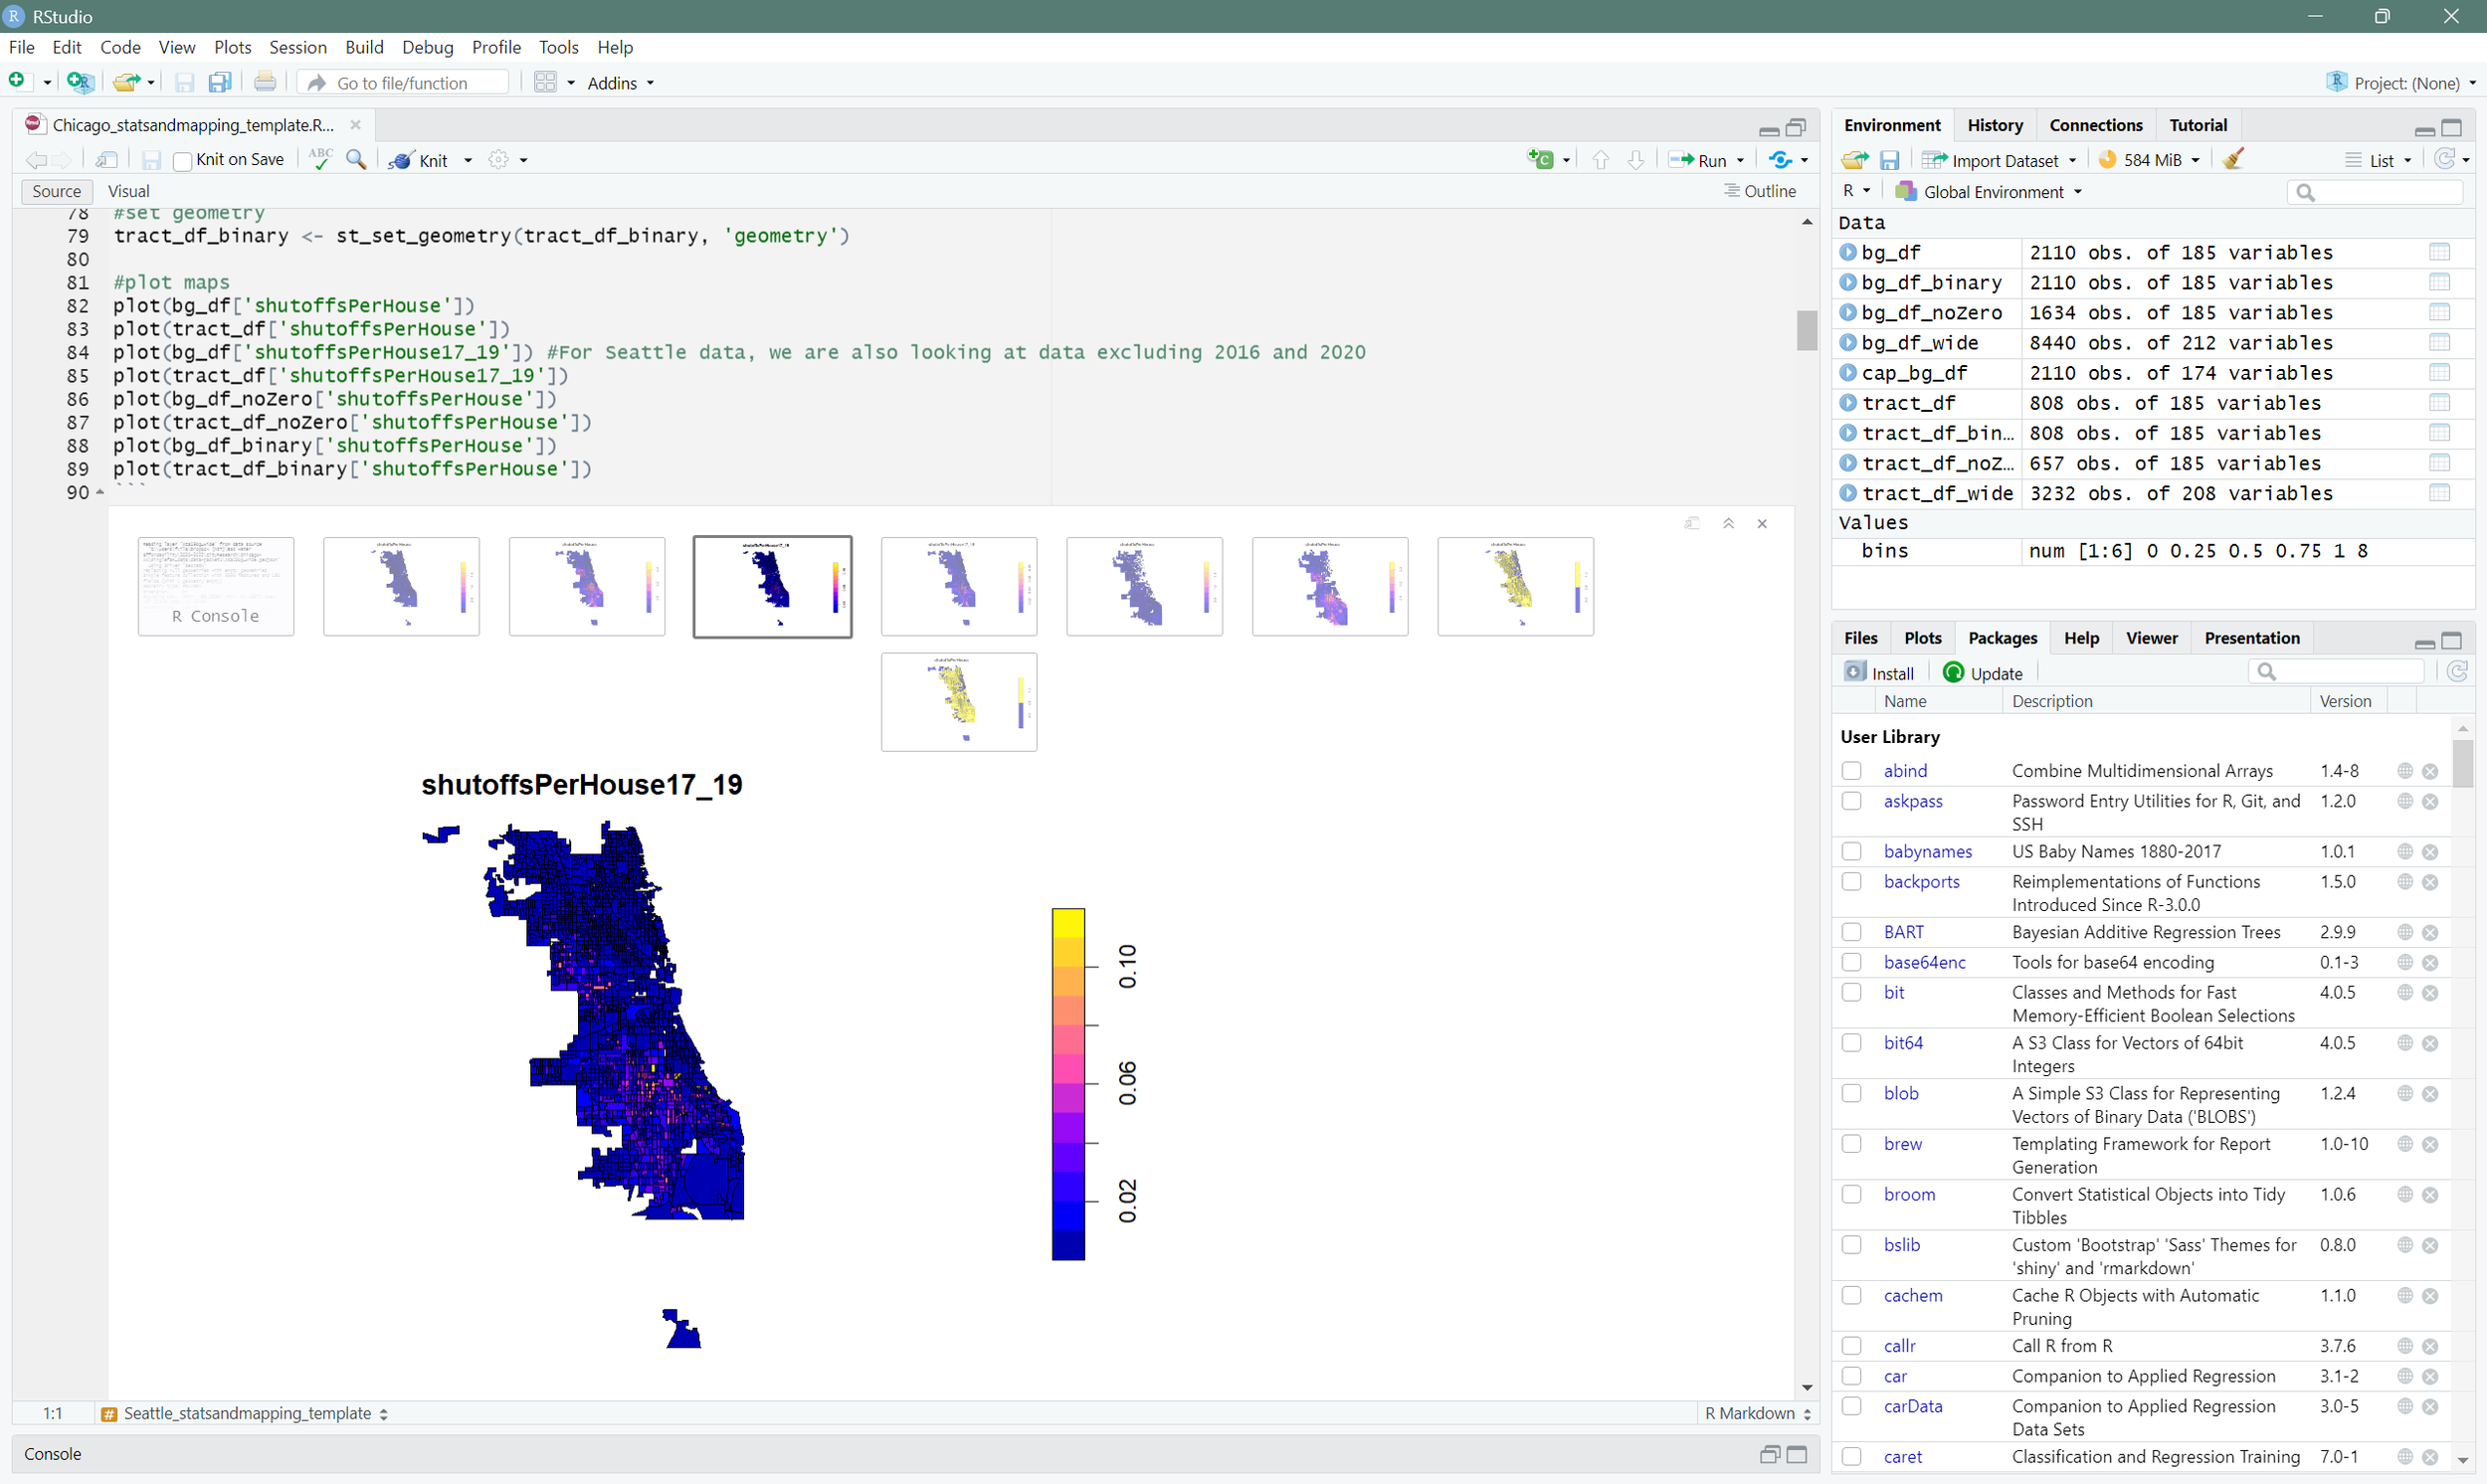
The hot spot analyses are performed through codes in R Studio where databases are processed to perform the spatial statistical analyses.
What is a hot spot analysis?
It is a statistical tool for identifying areas where specific values cluster significantly. Using the Getis-Ord Gi* method, this analysis highlights locations with high or low values and determines whether these concentrations are statistically significant. For an area to be considered a hot spot, it is not enough to have high values—other areas with similarly high values must also surround it.
This analysis is instrumental when combined with demographic maps, as it allows for comparing spatial patterns and a deeper understanding of how certain phenomena impact different communities. In city planning, it can help identify areas with a high concentration of issues, such as lack of access to services, economic inequality, or high housing costs, facilitating data-driven decision-making.